Friday, January 11, 2019

The Port Orchard, WA tornado of Dec 18, 2018

The strongest tornado in Washington State since 1986. hit the town of Port Orchard, a suburban-style town about 40 mi west of Seattle and east of the southern Olympic Mountains.  This story from KOMO nicely summarizes what happened.
https://komonews.com/news/local/storm-survey-team-heads-to-gauge-damage-from-port-orchard-tornado

According to the NWS Seattle office, the tornado produced EF2 damage to homes in a neighborhood and also a storage facility. While the tornado track was relatively short, it was as wide as 300 yards.  This event is the latest in several notable fall and early winter tornadoes that have occurred in western WA and northwest OR in recent years and is similar in strength to one that formed in the Pacific Ocean and came ashore to strike Manzanita, OR in October of 2016.


Where did this tornado come from and was the threat predictable?  Tornadoes are exceptionally rare in this part of the world; on average, only 1-2 occur in western Washington in a year. So there are not very many cases in which to build a rich repository of cases in which to build an analysis of common tornado-producing patterns.  This means we have to depend on detecting the ingredients favorable for producing tornadoes.  The tough part of this is that we don't know all the ingredients for tornadoes and even if we did, some may require observations that just aren't available to us on an operational basis.  Even in the traditional tornado alley, it's difficult to determine what exactly happened to create tornadoes in any one event. 

This case is no different in its marginal characteristics and didn't express the kind of predictability that operational meteorologists depend on to make a confident forecast.  The Storm Prediction Center only forecasted general thunder in their morning and midday severe weather outlooks.  This is, after all, the time of year when cold upper-level systems combine with the mild Pacific Ocean sea surface temperatures to generate instability, and this day was a classic case.   Enough instability to generate convection is one thing, but a tornado friendly environment? SPC isn't anticipating one.  The base situational awareness of forecasters and the public would likely be starting from a relatively low point.

But I don't think this event was undetectable, nor even unpredictable, and we have surface observing networks, model analysis, GOES data, and especially a WSR-88D not too far away.  Some of these data suggest that it would be possible to ramp up situational awareness quickly when the evidence appears to show that the morning forecast was understating the threat.  Let's assume the first indications that the environment may be favorable for tornadoes comes from the behavior of the storms themselves.

The first indication likely appeared from the development of the first detectable radar-observed signatures of rotation aloft.   By far, of all storm types, supercells provide the precursor signatures with the most predictability.  Squall line mesovortices can provide some predictability but with less lead time.  And nonmesocyclonic tornadoes (aka landspouts) often provide no precursor signatures from radar at all.  So, in this case, was there evidence of a supercell responsible for this tornado?

Here is the KATX WSR-88D radar loop for the two hours leading up to the tornado.  This four-panel loop started near noon PST (labeled here 1:59 pm CST in the reflectivity panel).  The parent cell of the tornado first appeared around an hour later, or 1 pm PST near Skokomish, WA.   Already the half degree velocity appears to show some positive shear.  Another 27 minutes had to pass, or by 1:32 pm PST  before the radar indicates that the parent cell strengthened enough to produce a real mesocyclone signature with a rotational velocity of 40 kts (This lesson on WDTD's home page describes a mesocyclone and how to measure rotational velocity).  At about the same time the differential reflectivity showed the onset of high Zdr values accompanying the reflectivity core.  The half degree beam from KATX centered around 1.2 km above the radar.  High Zdr values in high reflectivity most likely show large raindrops.  But at the next elevation scan up, around 2.1 km, the same high Zdr values appeared at this time and here the surrounding values dropped.  The Quillayute, WA sounding that morning showed the melting level around 1.4 km.   This was likely a Zdr column, a common sign of an updraft transporting liquid droplets above the melting layer.  These two features, updraft, and a mesocyclone persisted for 30 minutes with only minor fluctuations as the storm approached Port Orchard.  A cell with a persistent mesocyclone and updraft fits the description of a supercell.  The only feature not readily apparent is the absence of some kind of hook echo or a low-level reflectivity notch.   I'm not surprised we don't see these features since this storm was quite small, both vertically and horizontally. 


A four panel loop from the KATX WSR-88D covering the two hours prior to the Port Orchard tornado.  The panels start with reflectivity (upper left), base velocity (upper right), correlation coefficient (lower left) and differential reflectivity (lower right). 


A radar loop over the two hours leading up to the tornado from the WSR-88D KATX.  The reflectivity appears in the upper left, base velocity in the upper right, differential reflectivity (Zdr) in the lower right, and correlation coefficient (CC) in the lower left.


The Quillayute, WA sounding from 2018 Dec 18 12 UTC.
Were these signatures worthy of a credible tornado threat?
Accoing to the latest tornado warning guidance quick guide, 25% of mesocyclones with a rotational velocity of 40 kts are associated with tornadoes.  This is pretty high, and achieves the highest skill if the decision is made to classify this mesocyclone as tornadic when it reaches this rotational velocity. But there is a significant disclaimer.  The guidance makes no mention of the environmental conduciveness to creating a tornado.  Plenty of atmospheres can produce supercells but with no capability to generate a significant tornado threat.  While the guidance was taken from environments with tornado watches, was this environment worthy of seriously considering this guidance?  Well, the morning sounding shows a few signs that say yes, and a couple that gives me pause.

The left chart shows the probability of a mesocyclone being tornadic with a given low-level vortex signature strength presented by low-level differential velocity in m/s (LLDV) or rotational velocity in kts (LLRV).  The right panel indicates the Heidke Skill Score should the decision be made that the given mesocyclone is tornadic as a function of LLDV and LLRV.  The sources of information come from a 2003 Tornado Warning Guidance (TWG), a WDTD study, and Smith and co-authors in 2015.  The purple filled circle with a black border represents the rotational velocity of the Port Orchard mesocyclone at 1332 PST.

First, the good signs. The most favorable sign was a rather impressive 35 kts of bulk wind difference in the lowest 3 km above the surface, 21 kts in the lowest one kilometer (bulk wind difference is a very simplified representation of a more proper shear measurement).  Even more impressive, the shear direction sharply bent clockwise almost 90 degrees at roughly one km.  The hodograph looked quite similar to that of many tornado-producing profiles found in multiple composite studies.  The low-level 'sickle shape' of the hodograph permits a large amount of streamwise vorticity to be ingested into any convective updraft that manages to form. Two authors, John M. Esterheld and Donald J. Giuliano, studied the association between the low-level shear orientation and the storm-relative low-level wind and the categorization of supercells from nontornadic to significantly tornadic.  That angle is what's called the critical angle, and a value of 90 degrees would lead to having all of the horizontal vorticity represented by the shear to be streamwise.  The critical angle appeared to be the nearly 90 degrees for the Quillayute sounding.  

On the other hand, the feature giving me pause was that the thermodynamic profile barely showed any instability.  One representation of instability, CAPE, only yielded a meager 134 j/kg, and that's the maximum version available based on the morning sounding at Quillayute.  This amount was well below anything that the tornado warning guidance can offer as enough to generate a strong enough updraft for a supercell.  I would be looking for more before considering a reasonable prospect to generate a strong enough updraft.  The only positive attribute to the thermodynamics was that the low-level lapse rate was somewhat high, or in other words, there was not much convective inhibition.  But the presence of the storm in the afternoon surely pointed to more instability being available to the south and east of the Olympics than what the sounding showed.    Sure enough, the Regional Atmospheric Prediction (RAP) model painted a more unstable picture with nearly 280 j/kg of uncapped CAPE using a 100 mb deep mixed layer parcel from a 22 UTC analysis at a point near the storm's location.  A 100mb layer may be asking a lot for a storm who's depth was only 6 km.  Thus I checked the surface-based CAPE and it was 490 j/kg.  Perhaps the optimal layer from which a parcel may be drawn would be in the lowest 50 mb, but I think you get the picture that adequate CAPE appeared to be available.

The RAP sounding near Port Orchard valid 2018 Dec 18 22 UTC.  

The 0-3 km bulk wind difference and the storm-relative helicity in the 0-1 km and the 0-3 km layers were higher in this RAP sounding than for the Quillayute sounding.  Though the critical angle was less the component of the low-level shear oriented perpendicular to the 10 m storm-relative flow was still quite high.   And perhaps it's quite likely that the actual hodograph shape may have had a higher critical angle.  BTW, the critical angle, and the strength of the lower level shear really point to the fact that the streamwise vorticity was quite high.  Any mechanism to tilt such vorticity would readily produce a low-level mesocyclone, even for storms not deviating to the right.  The last severe storms conference in Stowe VT featured several studies of different types that indicated that we should pay more attention to streamwise vorticity.  As an aside, we appeared to be circling back to this parameter since it's importance in producing mesocyclones was first studied by Robert Davies Jones in the early 1980s.

Okay,  I only showed two sounding points, and one was from 12 UTC.  But what was the spatial pattern of the environment capable of producing supercells and tornadoes?  According to the 1-hour forecast of the 21 UTC RAP, Supercell Composite Parameter (SCP), most of western Washington State, and offshore areas had the potential for supercells.  The only area not favorable was located in the northeast Olympic Penisula and north, where both the deep layer vertical wind shear and CAPE were lacking in the RAP analysis.   The SPC formulation of the Significant Tornado Parameter (STP) was below 1 in all areas except for coastal Oregon where CAPE was high enough to keep the parameter above 1.  The RAP sounding above showed that the mixed layer CAPE likely brought down the STP to 0.2 but the fixed layer STP, which depends on surface-based CAPE, was higher.  Again, sometimes mixing the lowest 100 mb of the atmosphere may be too much to ask when we're talking about a shallow convective layer such as this day.  This even was not the first time that a significant tornado developed with barely any effective layer STP but higher fixed layer STP.

Above, the 21 UTC 1 hr RAP forecast of fixed layer Supercell Composite Parameter overlaid with 850 and 500 mb winds.
Above, the 21 UTC 1 hr RAP forecast of fixed layer Significant Tornado Parameter.

Thus returning to the question of whether there was enough information to issue a tornado warning.  I would say that there was.  Some events are completely undetectable and thus deny us the luxury of engaging in 20/20 hindsight.  But this one left enough to show that we can engage in this activity.

The KATX radar was fortunately close enough to depict a supercell with a mesocyclone strong enough to have perhaps a 30% chance of a tornado provided the environment supported the possibility of tornadoes.  The morning Quillayute sounding and the afternoon modified RAP analysis sounding showed hodograph profiles, sufficient CAPE, and low enough CIN to be favorable for tornadoes.  I won't even consider whether the boundary layer relative humidity was sufficiently high.  The environment had high relative humidity in the lowest 3 km and all soundings showed dewpoint depressions of only a few degrees at the surface.

Sometimes we need a little convincing that what appears to be favorable ingredients for rotating storms actually produced something elsewhere.   Well, it appeared this supercell was not the only one in the area.  The Multi-Radar/Multi-Sensor (MRMS) depicted another mesocyclone track in the Pacific that occurred a couple of hours earlier.
The MRMS rotation tracks product accumulated over six hours ending at 23 UTC 18 Dec 2018. A strong mesocyclone track appeared offshore west of the mouth of the Columbia River.  The other, southeast of the Olympics.
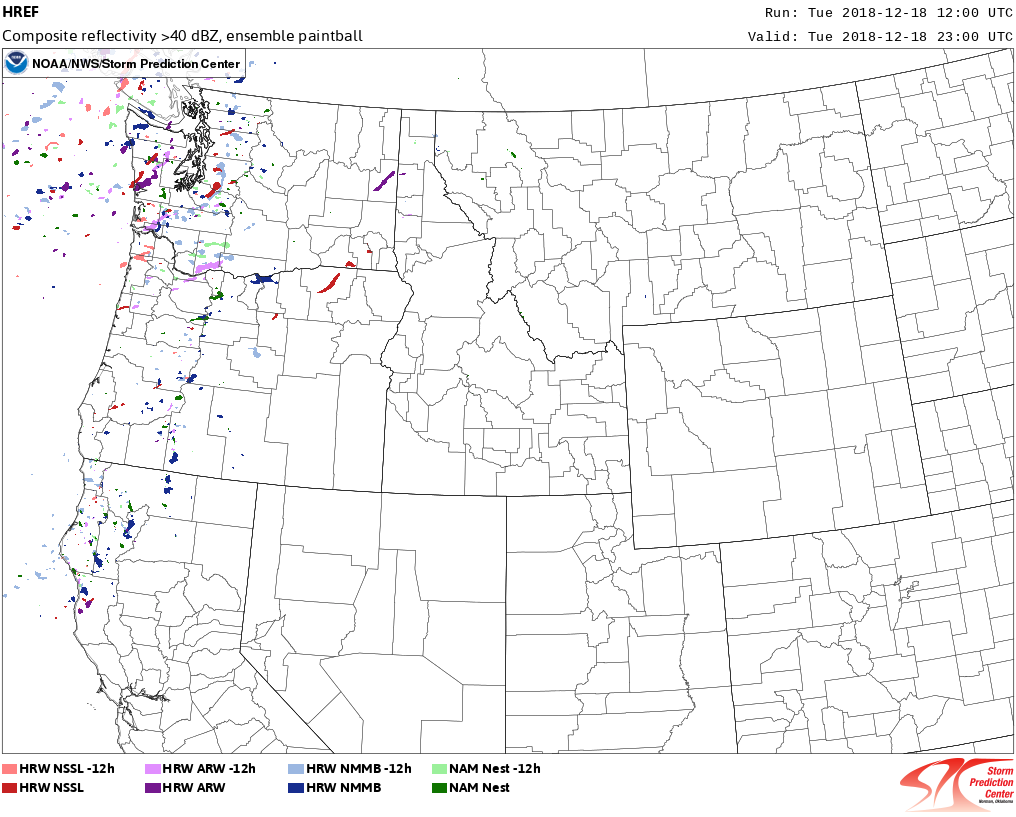
 More importantly, back to the question of the longer range outlook, was there any signal in the NWP guidance from earlier in the day that ought to be reconsidered? Well, the 12 UTC SPC High Resolution Ensemble Forecast (HREF) system did predict correctly that there would be plenty of CAPE, or at least a few hundred joules per kilogram, as the multi-panel display shows around the time of the tornado.  The HREF also showed that convective cells would be plentiful according to the 11-hour paintball plot of >40 dBZ reflectivity valid for the same time.


The HREF surface-based CAPE member plot valid 18 Dec 2018 22 UTC

The HREF paintball plot of reflectivity > 40 dBZ from each member, valid 18 Dec 2018 22 UTC

The HREF even showed that the fixed-layer sigTOR parameter would have an up to 30% chance of exceeding 1.  However, most of the high probabilities were close to the coast where the CAPE was the highest.  What happens inland was fracturing and lowering of probabilities.  While not zero, it would be hard to have any confidence of a significant threat, at least significant enough to warrant a tornado outlook from the 12 UTC runs.  And the updraft helicity forecast showed only one short-lived, low-value, plot in southwest Washington – hardly the kind of result that would promote anyone to raise the risk level.
The HREF probability of fixed-layer sigTOR parameter exceeding one, valid 18 Dec 2018 22 UTC
The HREF four hour ensemble maximum 2-5 km updraft helicity ending 19 Dec 2018 00 UTC
So while the morning guidance didn't impress, there was reason to be on the watch for that rare event. The HREF shows CAPE and a nonzero probability that sigTor values exceeding one.  The environment appeared to exceed expectations by just enough to allow more than one storm to produce a significant mesocyclone, one of those with a confirmed tornado, and the other not known due to its location.


Tuesday, August 21, 2018

The tornado wind measurement of 19 August 2018 in Inola, OK

Here's an interesting observation the Inola, OK mesonet site recorded after a tornado passed near or overhead.  The 2 meter, 3 second wind gust observation wound up being higher than that located at10 m.  The tornado responsible for this wind observation developed just southwest of the mesonet site, then struck a farm a mile to the northeast before moving on several more miles before dissipating.  Overall, this tornado was rated EF1 based on the damage to some barns and trees.

An infographic of the tornado track and the reported mesonet wind gusts from the Inola tornado of 2018 August 19. (courtesy of NWS Tulsa)
This event would seem to confirm that tornadoes can produce stronger winds very close to the ground and shows that tornado wind environments don't adhere to the log normal vertical wind speed profile assumed during larger, straight line severe wind storms.  While this rare measurement at two levels seem to confirm that tornadoes produce stronger winds below 10 m, there are some things I heard from several knowledgeable people in the mesonet program that may suggest the difference in wind gusts may be due to differences in instrumentation.   I contacted Chris Febrich, James Hocker, and Cindy Luttrell at the Oklahoma Climate Survey, the organization in charge of the Oklahoma Mesonet.  They mentioned that the 2 m anemometer is a standard wind cup while the one at 10 m is an RM Young propeller vane anemometer.  While not immediately obvious, their hypothesis suggested that the RM Young 10 m anemometer was not directed into the wind when the strongest gust arrived.  A possible reason for this was that the wind shifted rapidly with time and that the RM Young at 10m may not have turned into the wind in time to sample the full speed of the peak gust. A propeller vane anemometer isn't likely to sample the wind at full speed unless pointed directly into the wind.  And some time is needed for the vane to respond to a new wind direction.  Conversely a cup anemometer isn't sensitive to changes in horizontal wind direction.  Chris sent these few wind direction observations to highlight his concern.

171 degrees at 20:36
267 degrees at 20:37(moment of peak gust)
289 degrees at 20:38

Now, a vane anemometer is designed to completely reorient into a new wind direction in a much faster time interval than implied by these measurements.  But we are talking about a small tornado and so the changes in direction may have happened much more quickly.

Chris also pointed out that the mesonet record contains no instances where the 2m wind gust exceeded the 10m at the same place and time.  Within that period of record were four other mesonet sites struck by tornadoes.

So this doesn't put cold water on the possibility that stronger winds occurred at 2m vs 10m but it may mean we cannot use this case to show otherwise.  Still, these are interesting observations which align well with the observed damage from this tornado.  The link below gives you a drone-based view of the tornado path from where it passed through the mesonet site and then to the northeast to a farm residence.  
The peak wind speed at 2m altitude is quite consistent with the damage incurred to the farm that can be seen in the drone footage and also witnessed by Scott Peake that you can see in his video link below.

These kinds of observations don't come by very often, and when they do, it's most likely courtesy of a field project such as TWIRL (Tornadic Winds: In-situ and Radar observations at low Levels) operated by the Center for Severe Weather Research.  The teams in this project deployed portable surface stations into tornadoes to measure winds at 1m above the ground  while mobile radar teams measured the winds overhead.   The TWIRL project successfully deployed surface stations into two tornadoes, the 2018 May 9 Sulphur, OK tornado and the 2018 May 24 Dodge City area tornadoes.  Neither tornadoes had measured winds at 1m exceeded the wind speeds measured by nearby radar.  However, efforts to simultaneously measure winds at low and high levels in previous field programs, like VORTEX2, netted examples where winds measured at 10 m above ground exceeded the radar observations at higher altitudes.  And another event occurred where a serendipitus, and somewhat scary, encounter by a CSWR team produced very high resolution profile of winds where the maximum measured was only 3.5 m AGL.

So why the fuss about whether the strongest winds are at low vs higher levels?  It's because engineers design buildings to withstand a certain level of winds  tuned to a reference level of 10m (the kind measured at most airports) over 3 second durations and then assume the winds are weaker below that level and stronger above.  This wind profile is called a log normal wind profile.  So for example, engineers would typically construct a building able to withstand a 3 second long gust of 90 mph at 10 m above ground where they would assume the wind at 3 m above ground would be perhaps 75 mph, and a wind at 100m above ground would be stronger.  But the evidence shows tornadoes produce wind profiles that don't follow the log normal profile. And the result could be stresses on buildings that greatly exceed that produced by a standard log normal profile.  But to what level tornadoes deviate from the log normal profile is something we don't know.  Wouldn't it be nice if we did?  Then we could have a better idea of how to design buildings with improved tornado resistance.  The only way to find out is with more observations in a tornado boundary layer.  That's why even serendipitus observations are important.

BTW, I am a Chair of a standards committee for the American Society for Civil Engineering (ASCE) that seeks to put the guidance in wind speed estimates into a document that includes not only anemometers and radars but also wind speed estimates from the EF Scale, tree-fall patterns, remote aerial measurements and building forensics.  Hopefully soon we'll also include a section on photogrammetry such as what could be derived from Scott's video above.

Sunday, December 31, 2017

The Strong Great Lakes Mesovortex of 30 - 31 December 2017

One of the strongest lake-induced mesoscale vortices I've seen struck Marquette, MI yesterday with 60 mph wind gusts and an amazing longevity as it survived a passage over the UP of Michigan and then dropping straight south down the long axis of Lake Michigan last night to eventually make final landfall midday today on the Michigan, Indiana shoreline. The Great Lakes produces numerous vortices during its convective lake effect season, ranging from small misocyclones less than 4 km wide documented by a study by Steiger and co-authors in 2013, to 4-50 km mesoscale vortices documented by Laird and co-authors in 2001. Some misocyclones have been reported to have caused winds strong enough to break tree limbs along the Great Lakes shorelines possibly as they've intensified into weak tornadoes. But I have not heard of the larger vortices being strong enough to do the same kind of damage.  

These vortices can produce impacts when well-behaved snow bands suddenly take sideways departures to visit areas not predicted to receive snowfall. This one produced impacts even in an area well-accustomed to lake effect snow. The snowfall rate and high winds shut down at least one state highway where an accident shut down US-41 south of Marquette. An employee at the NWS Marquette shot two pictures of the event, one of the main convective band associated with the mesoscale vortex approaching them and then a few minutes later, a whiteout.


A tweet showing US-41 shut down due to whiteout conditions and an accident.

A picture, taken from the NWS Marquette, MI, shows the main convective band approaching shore to the north.


The peak wind gusts reported reached 60 mph near Marquette as the convective band on the western flank of the mesoscale vortex passed over the station.  The surface map provided by NWS Weather and Hazards Viewer.


As the mesovortex passed to the south and into Lake Michigan, residents around the Grand Traverse Bay tweeted pictures of funnel clouds, certainly representing tornado-like vortices. I'm not sure where these waterspouts were located relative to the mesolow but they may have been within a few hours of its passage.  It goes without saying that the mesolow was ripe with vorticity and the available convection to help concentrate into misocyclones and perhaps even weak tornadoes.


https://twitter.com/NWSGaylord/status/947266131450105861/photo/1

The impacts continued down Lake Michigan although perhaps in an unexpected way. The lake effect band plaguing the south shore of Lake Michigan for some hours quickly weakened before the arrival of the mesovortex, potentially providing a narrow window of unimpeded travel. However the arrival of the mesolow meant that snowbands reoriented themselves and reached areas not expected to experience lake effect given prevailing synoptic scale wind direction. The east-west band slapped a broad section of the southern lake Michigan shoreline with rapidly dropping visibilities and enhanced winds capable of causing brief whiteouts. While the shoreline didn't see the 60 mph winds from yesterday's Lake Superior landfall, they were certainly strong enough to simulate the wintertime equivalent of a thunderstorm but with the extra benefit of whiteout conditions and added ice cover on road surfaces.


A video loop of the Northern Indiana WSR-88D showing the impact of the mesolow on the location and behavior of the snow bands.


Maximum wind gusts from today's mesolow landfall in southern Lake Michigan.  Image courtesy of the Weather and Impacts display from the NWS.


This mesovortex event provided a platform to showcase two amazing advancements in meteorology. The first is the major upgrade in our GOES. The recent launch of GOES-16, and its placement as the eastern operational satellite provided a spectacular rapid update loops of the development and intensification of the mesolow over Lake Superior. the last minute explosion of convection that the canvassed the northern view from the NWS MQT office was well-captured one one-minute intervals from the satellite, manifested as rapidly expanding and glaciating anvils, similar to a summer thunderstorm. The satellite captured smooth ribbons of lake effect cloud streets converging into the mesolow from the north and east. The Marquette WSR-88D complimented the satellite by showing the internal structure of the mesolow and the strong winds whipping around its western flank.


The next day the new GOES captured another convective explosion just offshore of Lake Michigan's southern shore. The satellite explicitly showed the new convection convert from bright liquid water clouds to mostly ice the same way it did for summer thunderstorms.


The second showcase was the eerily accurate prediction by the NAM, NAM 3km and the HRRR models from even two days in advance. This amazing success was partly courtesy of the excellent analysis of the low pressure in advance of the arctic front over Lake Superior from the day before it intensified. But the models could take advantage of the excellent lake temperature and ice cover analysis, as well as the model advancements that allowed them to accurately depict the structure and motion of the mesolow.


NAM 3 km surface temperature and wind analysis from the night before the mesolow formed and intensified before hitting Marquette.

As an example, the 3 km NAM from the previous night accurately depicted the strong winds on the mesolow's western flank approaching Marquette during the middle of the day. It may have fallen short of the peak observed wind speeds but it certainly was good enough to show that a sudden onset whiteout conditions could be possible. And then in even more spectacular fashion, the same model run moved the mesolow down the axis of Lake Michigan.   


NAM 3 km 16 hour forecast surface winds and sea level pressure from 00 UTC Dec 30.


This persistent scenario depicted by the models prompted at least one NWS office to draft up a forecast and publish headlines announcing the mesolow's arrival a day ahead.


Finally, this mesolow has many of the characteristics of a tropical cyclone and polar lows.  It intensified over relatively warm waters of Lake Superior while a deep convective layer allowed for more intense concentration of the loose low pressure into something much tighter than I've seen before.  A deep convective layer for this time and place is only about 3 km.  The center of the low was surrounded by warm air, of 19-20 deg F, not the single digits or below zero readings from inland.  Perhaps the strong warming was partly courtesy of strong sensible heat fluxes when the mesolow began to intensify. It's a feedback process that can help explain the genesis of tropical cyclones.  In this cold environment, the process can only go so far.  Yet we're not talking about a cat 5 potential environment, just one strong enough to do what we've seen here.

A model sounding over Lake Michigan near the mesolow depicting the 3 km convective layer and vigorous vertical motion (horizontal orange lines).  Image courtesy of COD and SHARPPY.


Laird, N. F., L. J. Miller, and D. A. R. Kristovich, 2001: Synthetic dual-Doppler analysis of a winter mesoscale vortex. Mon. Wea. Rev., 129, 312–331, doi:https://doi.org/10.1175/1520-0493(2001)129<0312:SDDAOA>2.0.CO;2.  Link

Laird, N.F., L.J. Miller, and D.A. Kristovich, 2001: Synthetic Dual-Doppler Analysis of a Winter Mesoscale Vortex. Mon. Wea. Rev., 129, 312–331,https://doi.org/10.1175/1520-0493(2001)129<0312:SDDAOA>2.0.CO;2 

Linders, T. and Ø. Saetra, 2010: Can CAPE Maintain Polar Lows?. J. Atmos. Sci., 67, 2559–2571, https://doi.org/10.1175/2010JAS3131.1 

Steiger, S.M., R. Schrom, A. Stamm, D. Ruth, K. Jaszka, T. Kress, B. Rathbun, J. Frame, J. Wurman, and K. Kosiba, 2013: Circulations, Bounded Weak Echo Regions, and Horizontal Vortices Observed within Long-Lake-Axis-Parallel–Lake-Effect Storms by the Doppler on Wheels. Mon. Wea. Rev., 141, 2821–2840,https://doi.org/10.1175/MWR-D-12-00226.1 

Sunday, January 22, 2017

Rare and dangerous high risk of tornadoes in GA and FL


I haven't seen tornado outbreak environments like this in some years.  The latest Storm Prediction Center (SPC) outlook still has a high risk for severe storms including long-track significant tornadoes for portions of south Georgia into north Florida.  The last time that a high risk was issued by the SPC was almost three years ago according to Skip Talbot's Facebook post, and possibly no high risks have been forecast into the Florida peninsula.  Now storms are starting to form along and ahead of a cold front in the western FL panhandle and north along the GA, AL border.  Newer storms are firing up along the cold front south into the Gulf.  These should be of interest to anyone concerned about their safety which should include especially the high risk zone.

Later, more isolated storms will fire to the south and threaten the Florida peninsula.  While they may be more isolated, the environment will also support the potential for strong tornadoes.  The risk may not be high for Tampa, Orlando and Melbourne, but if you're unlucky enough to be in the path of a potentially tornadic storm, assume it'll produce significant tornadoes putting you at risk.


Areas north of the high risk may not see an obvious environment supportive of tornadoes because of the widespread rain in southern Georgia.  However this system is unusually far to the south, and our collective experience, limited.  Thus I suspect that even western to central Georgia may see a tornadic threat as the surface low deepens dramatically to something rarely seen in central GA - up to five standard deviations below normal for this time of year.  Outside of hurricanes, the sea level pressures will be very low down into FL as well.  As a result low-level winds will be strong and that means that if you're experiencing a cloudy, cool rainy atmosphere now, that may change quickly to one favorable for severe weather very quickly.   Residents in the Huntsville, AL area on the super tornado outbreak day of 2011 can relate to that.  Temperatures were in the 50's all afternoon and then in the last hour, jumped to near 70 deg F quickly followed by a mile-wide long-tracked tornado.


Furthermore, the probability that any one supercell will produce a significant tornado currently stands in the 15% range according to research by Smith and Thompson and Marsh of SPC in the last few years.  Get used to those numbers being extremely high.  As cases are gathered and return intervals calculated, you may see them as rather unusually high.  More importantly is that these numbers will go up from here as the day progresses.  The key thing to consider is that area hodographs feature large storm-relative helicity, very humid atmosphere (in an absolute and relative sense) and lots of buoyancy for thunderstorms to grow uninhibited, as seen from this sounding from the HRRR in the FL Panhandle ahead of the storms.


Bottom line, if your sheltering location is dusty, or cluttered, clear it now!


Thursday, January 12, 2017

What will roads be like Friday-Saturday central OK?

The next winter storm is upon us one week after the cold snow we experienced.  This time it's ice that's in the forecast and one big question is what the roads will be like.  After a nearly record warm day on Wednesday with temperatures near 80 deg F, the ground temperatures are at least 10 deg F warmer than right before the snow storm and with temperatures expected to drop to just a couple degrees below freezing, it'll be tough to cool the ground surface to below freezing.
But we're talking about freezing rain, right?  It makes all the difference in the world and this time the trend will be to keep ground temperatures warm.  As opposed to already frozen precipitation where upon landing and melting, extracts heat from the ground, rain deposits energy into the ground upon freezing.  If the ground, or the road surface, were to freeze, the energy will have to be extracted by another mechanism.  A continually fresh and deepening source of arctic air could accomplish this task.  However forecasts from all numerical guidance and the NWS paint a scenario where the near surface air barely remains below the melting point throughout Friday and into Saturday morning, early.  This is hardly the needed reservoir of cold required to cool the ground below the melting point in the face of all the latent heat to be added as the rain attempts to freeze.


Consider also that the rain will be falling from a layer nearly at 60 deg F a few thousand feet above ground and you are asking a lot of barely subfreezing air to cool the rain drops while also extracting heat from the ground and successfully fighting off the latent heat added by any attempts at freezing.


All this points to road surfaces remaining wet in central OK throughout the duration of the freezing rain event.

Now the exposure of elevated roads paint a different story.  The reservoir of heat will be eroded from multiple sides, allowing the surface to potentially reach a little below the melting point and allowing the potential for falling rain to freeze.  Bridges and overpasses could become slick if untreated.  But this event is well-forecast and hopefully the OKDOT attacks elevated surfaces before precipitation starts.  Since the NWS forecasts the potential for hazards to occur, they can't depend on knowing for sure what our efforts of mitigation may entail and thus pay heed to these graphics below.

The bottom line is that elevated surfaces may become slick, if untreated in central OK while colder air could be sufficient for all untreated roads in NW OK.

Ice will accumulate on all trees, power lines in central and NW OK.  However NW OK is most likely to bear the brunt of the heaviest rainfall.     Three quarter to one inch accumulation of ice will cause power outages there, and into Kansas and adjacent Missouri.  While this storm will not likely be equivalent to the catastrophic ice events of the past 16 years, it'll be bad enough.


Thursday, January 5, 2017

Fast moving snow system to hit central OK tonight

Our first accumulating snow event of the season is looking more likely tonight.  I've been monitoring the forecasts over the past several days and only by two days ago did the forecasts have enough confidence that snow would indeed happen.  The impacts will be quite clear.  Confidence is high that a period of accumulating snow will occur between midnight and 6 am, with the heaviest rates occurring within a couple hours of 3 am.  The timing and accumulations are pretty well represented by the 09 UTC short range ensemble forecast (SREF) of snow depth, to which the NWS forecast office agrees.  However, the SREF forecasts a large uncertainty in snow fall, anywhere from 0.5 to 6"!  If you're the cautious type, you may want to consider planning for a 4+ inch event with much of it coming down in a hurry just before the morning rush hour begins tomorrow.


But you may want to ask how much of that snow will stick to the roads.  Considering the possibility that no road crews go out tonight to pre-treat the roads with salt, an apt possibility for neighborhoods and minor roads, then all of the falling snow will remain frozen after landing.  We've had nearly 36 continuous hours of subfreezing air, broken only by a few hours of temperatures a little above freezing yesterday afternoon.  The Oklahoma mesonet soil temperatures 2-5 cm below ground in east OKC responded to yesterday's warm temperatures by rising to 40 deg F but since have fallen below 35 deg F this morning.  Other central OK mesonet soil temperature sites have responded similarly.  With plenty of arctic air feeding in from the north, all forecast 2 meter temperatures remain well below freezing, with a falling trend, through tonight and into tomorrow morning.  The ground temperatures should easily fall below freezing before the first snow falls.  Certainly all elevated roads will be even colder.


The impact means all untreated roads will be snow covered by 5 am tomorrow.  These include neighborhood roads and minor streets, or in other words, where most people will attempt to depart.  On the other hand, I would expect main snow routes, highways and bridges to be treated in advance of the snow.  Once they're treated the chemicals should easily melt a 2" snow cover within a couple hours of the snow ending which should be in time for the majority of a morning commute as a majority of forecast guidance anticipates snow tapering off by 6 am.  I would expect an hour or two delay should be sufficient to allow any remaining snow on treated routes to melt.

Now to be cautious, there are a few possibilities that may cause further delays for you.  The temperatures tomorrow will remain well below freezing and so all unplowed snow in shaded roads will remain and there's a good chance enough clouds will remain that even normally sunny road surfaces will stay below freezing.  Another issue could be if the DOT is delayed treating roads until the morning.  You'll know quickly about that if you come upon a normally treated road and it's white.  Or there is a third possibility of snow covered roads, even in treated areas, if the snow fall exceeds forecasts or if the heaviest falling snow gets delayed into the morning commute.

What is the possibility of getting more snow or the heaviest snow occurring after 6 am?  I expect the possibility of both to be there.  To understand why, consider the plots below.  Our event will come from the intersection of an upper level storm system, marked by the 'L' in northern California this morning, and the elevated frontal boundary marking the top of the arctic air dome shown by the strong temperature gradient at the 700 mb level seen below.  This type of upper-level storm provides forcing for rising motion well above the ground usually in the shape of a wave  and the front provides the assist a little lower in the form of bands parallel to the temperature contours.  The relative humidity pattern at the level of the frontal boundary aloft, also at 700 mb, indicates the air is already saturated and likely lifting along bands.   When the upper-level system begins to arrive late tonight one or more bands along the front may intensify and drop heavy snow, heavier than forecast.  The higher resolution models show some indications of bands, however the southern one doesn't last long appears to be more a reflection of the upper-level system.  Yet a stationary band across the metro area is in a realm of possibilties and it could last into the morning commute resulting in plowable snow accumulations and more snow covered main routes.


One final interesting thing to consider with this snow event is whether or not we'll get the beautiful six-sided dendrite crystals.  Consider that to get this kind of snow, we want to see strong rising motion occurring in the -12 to -18 deg C temperature layer aloft.  Consider a forecast sounding below from the morning NAM model.  The cold air at low levels is forecast to become cold enough to generate dendrites but there's not much in the way of rising motion.  However thanks to warm air above the arctic air layer, we extend the optimal temperatures for dendrites into the layer where strong rising motion is forecast to occur.  So with the cold surface temperatures, we should wake up to lots of dendrites.  That's in theory.  In reality, lots of factors may interrupt the processes to create spectacular dendrites but at least the possibility is there.